Machine Learning and Artificial Intelligence
(Predictive Risk Assessment for Corrosion and CUI Management System)
Predictive Risk Assessment for Corrosion and CUI Management System
Corrosion and CUI Management System
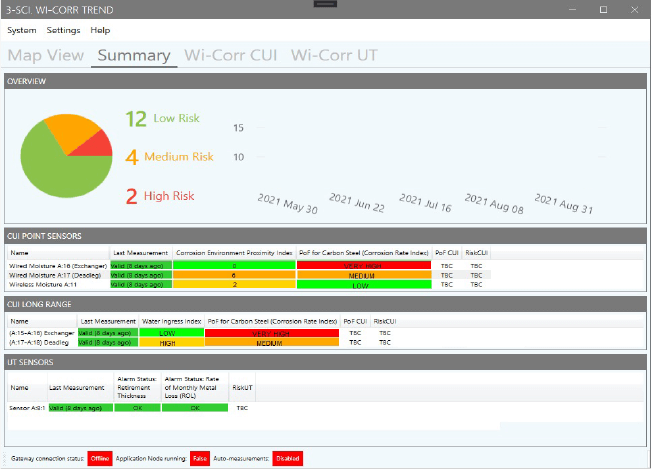
Using proprietary Wi-Corr TREND software, the system provide overall overview on the overall sensors network and location inside the facilities. It provide a quick view through data visualization for asset owner to identify which area or asset that require attention. The classification and prioritization enables a systematic reporting which give early warning and provide opportunity for early intervention.
The system is flexible to accommodate large number of data points and reliable which can support the decision making by the asset owner while keeping the data and incidents tracked over time.
New data, input and parameters are easily scalable based on the improvement that may be required from the asset owner or any industry standard updates or recommendations.
Electrical Motor Driven Equipment
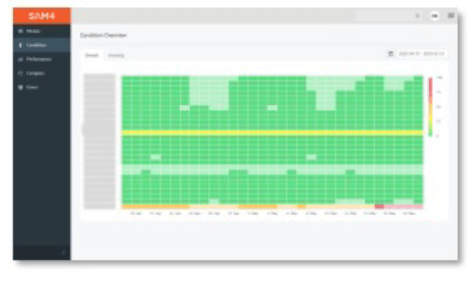
Asset health
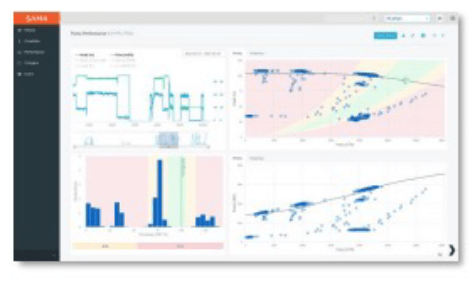
Asset performance
Energy monitor
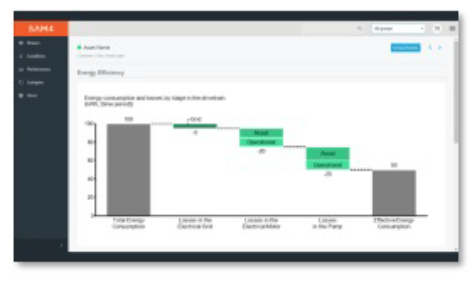
Insights to identify inefficiencies and achieve energy savings
Operational metrics
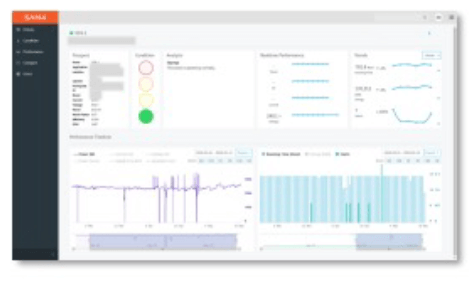
Descriptive information on how assets are operated
Reciprocating Compressors and Pumps
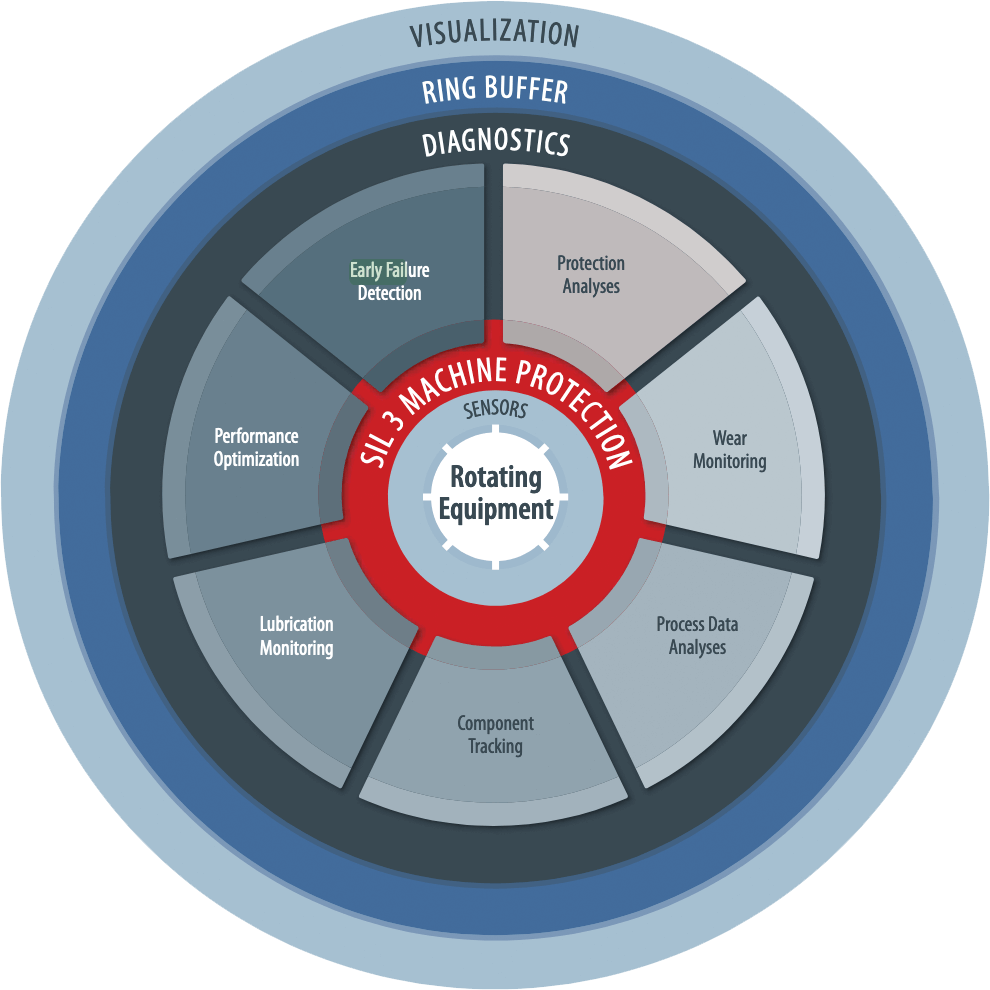
Early Failure Detection
Detects developing damage at an early stage while accounting for changing operating conditions to avoid false alarms.
Wear Monitoring
Provides wear trend plots of critical components.
Process Data Analyses
Displays and monitors defined DCS values as trends.
Protection Analyses
Visualizes and saves online and trend data to provide all information required for precise root cause analyses.
Performance Optimization
Evaluates the efficiency of a compressor and its sealing elements with automated p-V diagram analyses.
Lubrication Monitoring
Monitors the flow rate of every individual lubrication point by trend analysis.
Component Tracking
A tool for planning and tracking maintenance activities along with real-time component lifetime information.
Predictive Maintenance
Corrosion and CUI Management System
Using proprietary Wi-Corr TREND software, the system provide overall overview on the overall sensors network and location inside the facilities. It provide a quick view through data visualization for asset owner to identify which area or asset that require attention. The classification and prioritization enables a systematic reporting which give early warning and provide opportunity for early intervention.
The system is flexible to accommodate large number of data points and reliable which can support the decision making by the asset owner while keeping the data and incidents tracked over time.
New data, input and parameters are easily scalable based on the improvement that may be required from the asset owner or any industry standard updates or recommendations.

Online Valve Operability Assessment
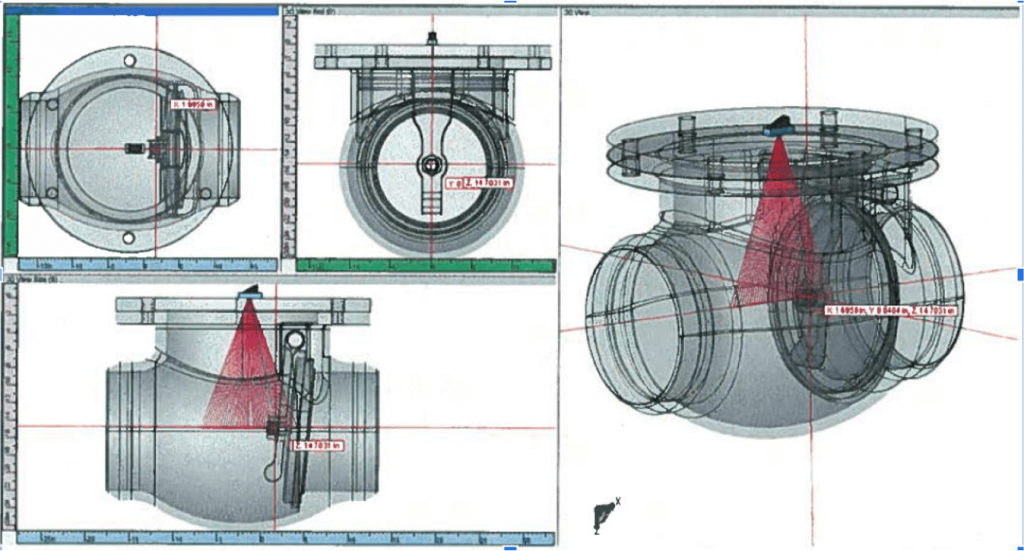
PASS® proprietary technology used advanced method and simulation which allow online diagnostic analysis
Currently, typical methods of non-intrusive tests for valves are acoustic emission, magnetic and radiography. In the acoustic emission method, contact noises from internal components impacting the body or seating areas are detected and analyzed.
However, when the non-intrusive tests are judged to be ineffective due to the valves’ characteristics, disassembly and visual inspections are carried out to verify the valve condition.
Disassembly of valves brings considerable disadvantages in terms of time and cost. Particularly in refinery, petrochemical, LNG plants, disassembly and visual inspection require additional work such as installation of radiation shields, decontamination of the inside of the valves, and strict foreign material control
Using proprietary valve inspection and diagnostic system which is a state-of-the-art nonintrusive valve diagnostic system which adopts the cutting-edge ultrasonic technology to observe the internal components of valves during live/online plant operation. Together with the Visualization Software, it provides a comprehensive solution for Phased Array UT (PAUT) data analysis and field interpretation
Electrical Motor Driven Equipment
Asset health

Asset performance

Energy monitor

Insights to identify inefficiencies and achieve energy savings
Operational metrics

Descriptive information on how assets are operated
Reciprocating Compressors and Pumps

Protection Analyses
Early Failure Detection
Wear Monitoring
Performance Optimization
Lubrication Monitoring
Monitors the flow rate of every individual lubrication point by trend analysis.
Process Data Analyses
Displays and monitors defined DCS values as trends.
